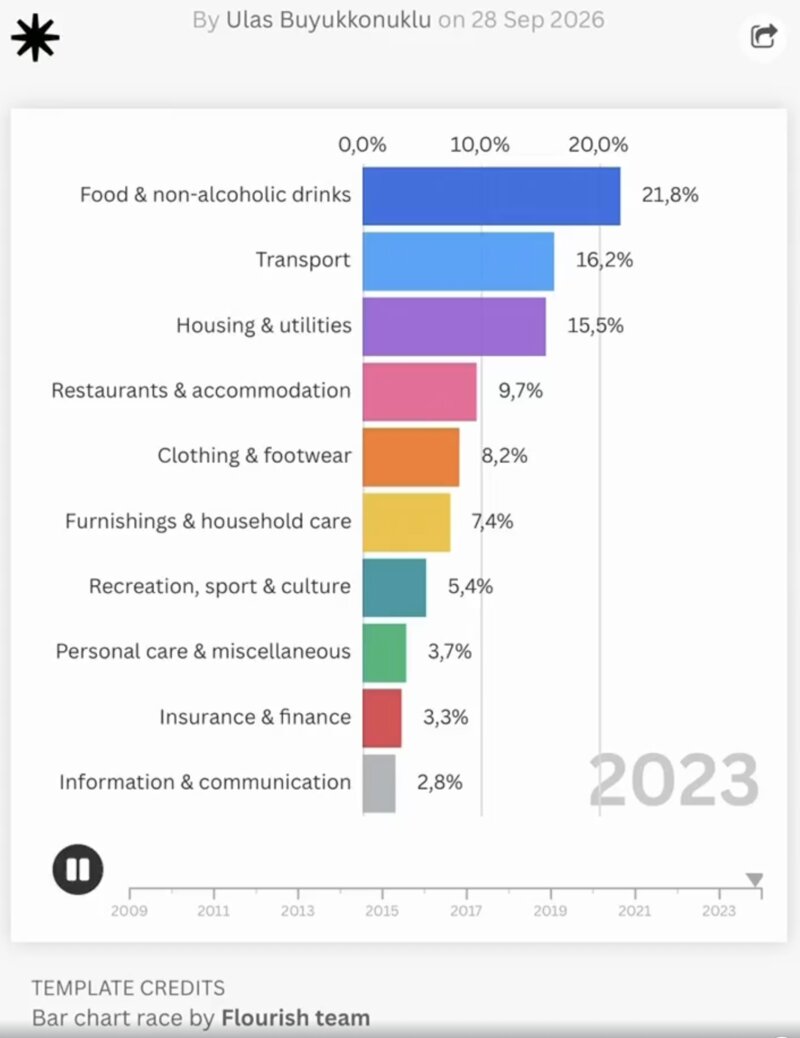
Food remained the largest spending category, while transport caught up with housing and utilities:
- Food and non-alcoholic beverages fell from 22.47% to 21.72% of total spending.
- Transport rose from 12.38% to 15.90%.
- Housing and utilities declined from 21.95% to 15.85%.
- Restaurants and accommodation increased from 6.85% to 9.69%.
In 2009, transport accounted for a much smaller share of spending than housing and utilities.
By 2024, their shares were nearly equal, with transport slightly ahead.
Changes in spending shares reflect both price changes and changes in consumption volumes.
Which shift stands out most to you?