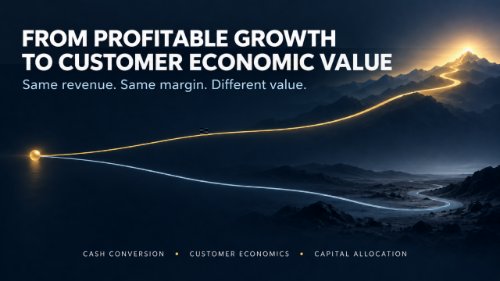
Why cash conversion, customer economics and capital allocation belong in the same management conversation
Profitable growth is a good result. But it is not the end of the story.
I have seen businesses grow revenue and improve EBITDA while facing more pressure on cash. The P&L can be moving in the right direction, yet inventory is rising, customers are taking longer to pay, and expansion is requiring more capital than expected.
The question then is not only whether growth is profitable. It is whether that growth converts into cash, and whether the capital committed to it earns an adequate return.
That question led me from company-level cash flow to a more specific issue: which customers actually create economic value?
Growth has to be funded
More sales often require more inventory. Commercial growth may come with longer payment terms or more demanding service commitments. Supplier terms may not move at the same pace. Capex, new capacity and market expansion can add another layer of funding needs.
None of these decisions is necessarily wrong. The issue is whether we can see their cash consequences early enough to make a deliberate choice.
Cash flow should therefore be managed as a business outcome. Finance can connect P&L decisions to their cash impact and challenge assumptions. But Commercial, Operations, Procurement and Finance all influence how much cash growth consumes and how quickly it returns.
One comment on my first post made the point particularly well: inventory can be the quietest part of the story. Small additions across a large product range may look reasonable item by item, while the warehouse absorbs a significant amount of cash in aggregate.
A healthy average can hide an unhealthy customer
The cash conversion cycle is useful. It tells us how long cash is tied up between paying suppliers and collecting from customers. But a consolidated average does not show where the pressure originates.
One channel may generate cash while another consumes it. Within the same channel, customer segments can behave differently. And within a segment, individual customers may have very different payment patterns, inventory needs and service costs.
The analysis has to move through the business:
Company → Channel → Customer segment → Customer
At each step, the question becomes more actionable. Instead of only asking, “Is our CCC improving?”, we can ask where cash is trapped, which parts of growth require disproportionate working capital, and which decisions would change that position.
Granularity alone is not enough, however. As one reader observed, finding trapped cash tells us where to look; putting a price on the capital tells us whether the return justifies it.
Same revenue and margin, different economics
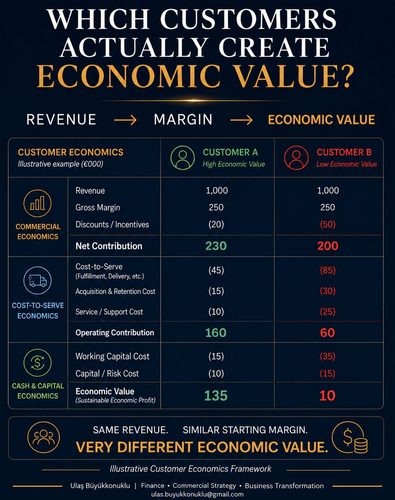
Consider two customers with €1.0m of revenue and €250k of gross margin each. On a standard sales report, they appear equally attractive. But the commercial and operating conditions behind those numbers are different.
The difference does not come from revenue or gross margin. It comes from discounts, the resources required to serve the customer, and the cash tied up in the relationship.
Customer B pays in 90 days rather than 30, requires more inventory, and benefits from shorter supplier terms. That combination makes the relationship far more capital intensive. The capital charge is an economic hurdle for that capital; it is not an additional cash payment. The cash impact appears in the working-capital movement itself.
The model is deliberately simple, but it changes the commercial discussion. A high-revenue account may still deserve investment. It may also need different pricing, payment terms, inventory commitments or a service model that reflects the resources it uses.
What the model can and cannot tell us
The comments on the customer example raised a fair challenge: customer-level costs and capital are not always easy to assign. An average allocation can make a fixed cost appear incremental, or imply precision that the data does not support.
I would use the model as a decision tool, with the assumptions visible. Costs that change with the customer should be separated from shared capacity costs. Working capital should reflect the customer's actual payment behaviour and inventory requirements where possible. Where allocation is unavoidable, it should be labelled and tested as a range.
The point is not to manufacture a single “true” customer profit number. It is to understand which conclusion remains valid when the assumptions change. If the ranking of two customers reverses with a small change in cost allocation, management should know that before making a pricing or growth decision.
There is also a time dimension. A customer that creates value today may become more capital intensive as volumes increase, payment terms stretch or service complexity rises. Another may deepen its relationship, improve payment discipline and require less acquisition spending over time. Retention quality, concentration and renewal risk matter as well.
That leads to a better forward-looking question:
If this customer grows by 20%, how much additional cash and capital will we need, and what return will that incremental growth earn?
From a static answer to a better decision
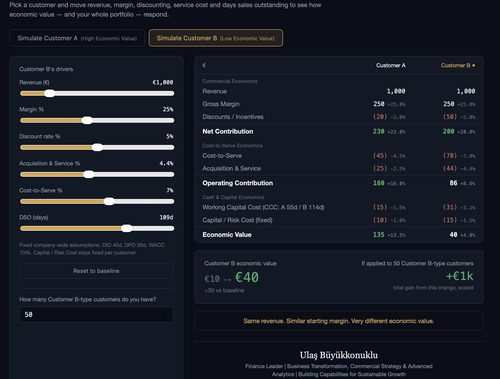
This is why I turned the example into an interactive simulator. Changing discounts, service costs or collection days makes the trade-offs visible immediately. Scaling a result across 50 similar customers also shows how small account-level decisions can become material at portfolio level.
The live version uses its own illustrative baseline. Move revenue, margin, discounts, service costs or collection days and see how customer and portfolio value respond.
The useful output is not the model's final number alone. It is the conversation around the assumptions:
- Would a shorter payment term improve the economics enough to justify a commercial concession elsewhere?
- Is the inventory commitment necessary for the promised service level?
- Which service activities are genuinely incremental, and which use existing capacity?
- Would we make the same growth decision if we assessed the additional capital required, rather than today's margin alone?
AI helped build the simulator quickly. It does not validate the data, decide which assumptions are reasonable, or take responsibility for the commercial choice. That remains a management judgment.
A more complete performance question
Revenue tells us whether customers are buying. Margin tells us something about what those sales contribute. Cash conversion shows how much funding the business needs to support them. Capital-adjusted economics asks whether that funding earns a worthwhile return.
These are connected views of the same growth decision. Averages help us monitor the business; customer-level analysis helps us act. A model can make the trade-offs explicit; judgment determines what to do with them.
For me, the management question is now:
Where should we grow, on what terms, and with how much capital?
That is where Finance and Commercial strategy meet. And it is where profitable growth has a better chance of becoming sustainable economic value.
The numerical example is illustrative. Customer economic profit here means operating contribution less an illustrative capital charge on customer capital employed. It is a decision metric, not a customer cash-flow statement or a reported accounting measure.